


|
|
DOI Prefix 10.20431 |
Information
Journal Policies
The Management Ability for Head Nurses Assessed by Using Kendall's Coefficient of Concordance
Shu-Ching Ma1,2, Tsair-Wei Chien3
2.Assistant Professor, Southern Taiwan University of Science and Technology.
3.Associate Professor, Research Department, Chi-Mei Medical Center.
Copyright : © 2018 Authors. This is an open-access article distributed under the terms of the Creative Commons Attribution License, which permits unrestricted use, distribution, and reproduction in any medium, provided the original author and source are credited.
Objectives: To assess the head nurses using Kendall's coefficient of Concordance.
Methods: An approach to assess the management ability of nurse heads was to collect data evaluated by nursing supervisors on 5-point ten management core axes in hospital. We analyze (1) the relation of Cronbach's α and Kendall's coefficient of concordance; (2) performance presentations on Google maps with visual displays; (3) the association between summation scores and the age of nurse heads.
Results: We found that (1) the relation between Cronbach's α and Kendall's coefficient is significantly strong(r=0.61, t=5.87) in concordance(Kendall =0.85, χ2 =100.38,df=59, p< .0001); (2) the dashboard shown on the Google map with multidisciplinary functionalities is merit; (3)the association between summation
scores and the age is trivial (r=0.18, t=1.5) without concordance(Kendall =0.59( χ 2 =76.33, df=65, p=0.16).
Conclusion: The demonstration of performance sheet is shown on Google maps with a dashboard. The Kendall's coefficient of concordance can be used for an example in assessing the selection of the nurse head in the hospital as well as in evaluating many kinds of competition judged by referees in the future.
nurse head, Google maps, Kendall's coefficient, dashboard,Nursing and Healthcare
1. Background
A head nurse (as known as a chief nurse) in charge of nursing in a hospital is the head of the nursing staff and a registered nurse who supervises the care of all the patients, usually in a ward, or a health care facility[1]. Traditionally, head nurses wore a dark-blue dress that was usually darker than that of her subordinates in addition to a white-starched hat [2] and usually provides strong leadership and acts as a link between board-level nurses and clinical practice [3]. In the US military hospitals, head nurses are charged with the responsibility of making twice-daily rounds to supervise the nurses' duty performance [4].
Many large healthcare organizations such as medical center also have this kind of head nurses in healthcare service. They supervise a particular service and have insights into the facility or system such as surgical services, women's services, emergency services, critical care services, etc.
As of May 10 in 2018, 415 papers were found in Medline by searching keywords of (head nurse[Title]) OR chief nurse[Title] . However, only 18 exist with keywords of ((head nurse[Title]) OR chief nurse[Title]) and performance. Englebright and Perlin [5] explored characteristics of head nurse required for success in those increasingly responsible and visible roles. Melnyk and her colleagues [6] addressed that head nurses and hospital administrators need to invest in providing resources and an evidence-based culture so that clinicians can routinely implement evidence-based practice as the foundation of care to achieve higher healthcare quality and safety along with decreased costs. Babaeipour-Divshali et al. [7] suggested providing Head Nurse Empowerment Program (HNEP) that can be used as a promoting tool in the nursing profession to increase head nurses' management skills and enhance job satisfaction among the staff nurses. However, none in those 18 papers regarding head nurse's performance has proposed an assessment system that can guide head nurses to improve their ability and skill in healthcare settings.
In hospital setting, we have observed many kinds of assessment or questionnaire to evaluate examinees' performance such as annual personal performance evaluation, nursing professional ability advanced evaluation, or such an Objective Structured Clinical Examination(OSCE)[8,9], etc.. The most frequent type of assessment for head nurse is the annual personal performance evaluation.
The competence has frequently been discussed and applied to the field of human resources [10-12]. For instance, the competence can refer to nursing recruitment and the selection and promotion of personnel [13]. The competence can aid workforce allocation regarding staffing and development [14] and assist the selection of personnel for rewards and promotions based on performance evaluation criteria [15]. All of these factors require objective measurements in practice. We are thus interested in applying Kendall's coefficient of concordance (KCC for short in this study) [16] to objectively assess the performance of head nurses because KCC makes no assumptions regarding the nature of the probability distribution and can handle any number of distinct outcomes [17]. A novel way to visualize the results on the Google maps is worthily illustrated and shared with readers because Google maps have provided users to gain an overall geospatial visualization [18,19].
A study regarding the association between physician age and performance on the American Board of Emergency Medicine (ABEM) ConCert examination revealed that there was an association between advancing age and declining performance [20]. Another study investigated whether aging is associated with baseline crisis resource management (CRM) skills of acute care physicians (ACPs) and whether aging influences are learning from simulation-based education [21]. We are again interested in analyzing the relation between the performance and the age of the head nurses.
Our aims are to inspect (i)whether both KCC and Cronbach's are associated, and consistent with each other on subscales of the annual personal performance evaluation for head nurses in hospital; (ii) how to build a visual display on Google maps to show the performance of head nurses; (iii) what is the relation or the KCC effect between the total score and the age for the study head nurses.
2. Methods
According to literature reviews and brain storms in a nursing department of a medical center in Taiwan, 37-item 5-point Likert-type instrument for ten subscales (see Additional file 1) were constructed and applied to the annual personal performance evaluation for head nurses at the end in 2017. The ten subscales were responded (i.e., 5: Strongly disagree,4: Disagree,3: Neutral,2: Disagree, 1: Strongly disagree) by the six nurse supervisors to 66 head nurses. Finally, the composite scores for each domain(axis) constructed a 66(person)*10(domain) composite dataset.
2.2.1. Kendall's coefficient of concordance (KCC)
For calculating KCC, we firstly ranked the responses across items in each domain and assigned a serial number from 1 to the number of examinees. The higher response was assigned, the greater ranking score. The tie on rankings was endorsed with the mean (e.g., the lower three responses with an equal score are given the mean (=2=(1+2_3)/3).
When persons are on rows and items in columns, the summation of the deviation from the mean squared (i.e., using the MS Excel function DEVSQ) was applied to the row summation. Kendall's W from 0 to 1 is yielded by the function (=12*DEVSQ/(k^2*(n^3-n)), where k=item length and n=person size. The Chi-square is calculated by the equation(=k*(n-1)*W. The p-value equals CHIDIST( χ 2 , df), where df= degree of freedom=n-1). We will reject the null hypothesis (i.e., W=0, inconsistency amongst items or raters) if the p-value is less than the significant level of 0.05. The study flowchart is shown in Figure 1. If SPSS statistical software was applied, the steps are proceeded as following: Analysis→ Non-parameter test→History dialog records→k correlation sample→ Kendall's W test checked, and the statistical results including W and X2 test will appear on the canvas.

2.2.2. Cronbach's α
We computed all those 60 Cronbach's for those ten subscales responded by the six nurse supervisors. Accordingly, the relation between Cronbach's and Kendall's W can be drawn. Kendall's W on the two variables of Cronbach's αand Kendall's W can also be computed and tested.
To avoid the difference in lenient and severe judgment among nurse supervisors, we adjusted the subscale scores by using the equation (=each response – the subscale's mean) on each supervisor's subscale. That is, the means of all the supervisor's subscales are equal (=0). The Kendall's W can be yielded by those 66(persons) *10(items) dataset accordingly.
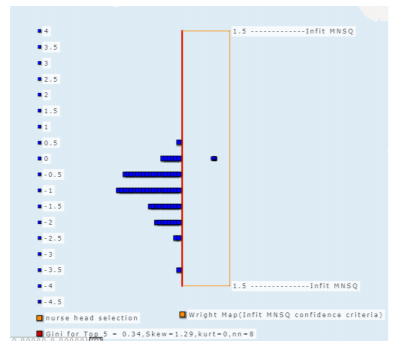
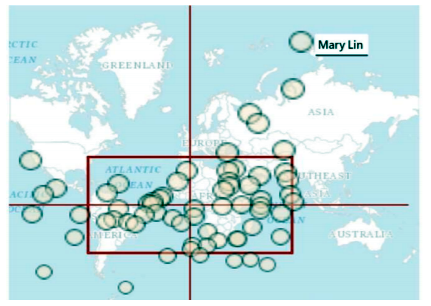
Rasch model for continuous responses [22,23] was used for estimating the person (i.e., head nurse) performance, calibrating the item difficulties, and computing Rasch fit statistics. If Infit mean square errors(MNSQ) for each item are less than 1.5, the unidimensionality scale is formed [23]. The variable map (also known as Wright map [24]) will be shown on the Google maps. The animated dashboard for the performance of head nurses can be also displayed on the Google maps, on which logit(=log odds) scores on the vertical(the higher, the better), and Z-score(=observed score – expected score) /standard deviation) for subscales on the horizontal(the higher, the more beyond the expected score). A rectangle box to circle the range within 95% confidence interval is plotted on the map. Each kind of domain performance for all head nurses will be popped up if the very icon was clicked. The names of the head nurse mean the one performing best in the domain.
For displaying the relation between the summation score and the age for head nurses, we calculated Kendall's W and tested the significance in statistics.
3. Results
The age stratification is shown in Figure 2, indicating the special (e.g., ICU) wards have a higher age than those in ordinary wards. Most of the head nurses whose ages are ranged between 35 and 40. What the correlation coefficient between Cronbach's α and Kendall's W for the total subscales of the ten domains assess by nurse supervisors is 0.61(p< 0.05; t=5.87= r*√(n-2)/1-rΛ2)). Kendall's W for concordance between these two variables(Cronbach's α and Kendall's W)of all subscales is 0.85( α 2 =100.38,df=59.00, p < 0.0001), indicating Cronbach's α and Kendall's has a high concordance and internal consistency.

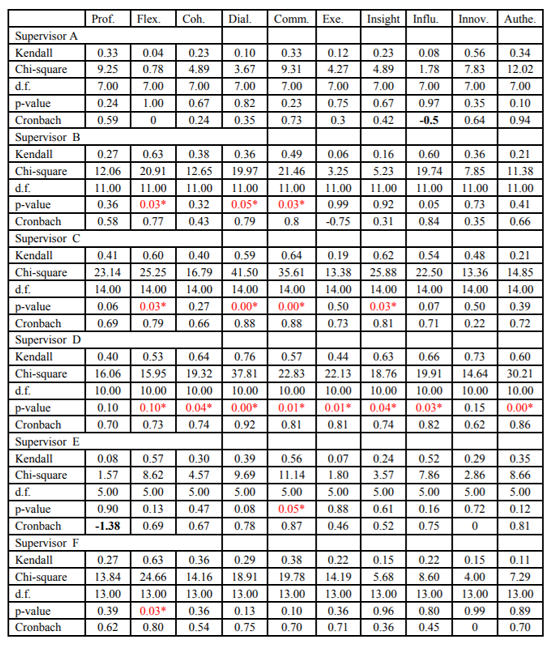
However, among the subscales assessed by nurse supervisors, we found only the supervisor D whose subscales present the most number of Kendall's W in concordance. That is, the examinees' scores across items have high correlations, followed by the supervisor C. In contrast, the supervisor A has no any subscale displaying concordant, see Table 1. It is worth noting that the Authenticity subscale assessed by the supervisor A shows Cronbach's α =0.94. It is because only one with a very low score causes a very high variance on persons and results in a high Cronbach's α In contrast, Kendall's W is 0.34 to reflect the more fact in concordance.
On the other hand, Cronbach's α might be negative which is seen in Table 1 on the two subscales(i.e., Professionality subscale of supervisor E and Influence subscale of supervisor A). The Innovation subscale of supervisor E whose Cronbach's αequals zero.
The variable map is shown with a visual dashboard [25] on the Google maps by the cloud computation technique[26], see Figure 3, indicating person logit score normally dispersed on the left side and the most located near to -1 logits. The items are together located in a spot which is the reason that all items have a common total score because the ranking scores and the item difficulties (=0 logit) are all equal. The item Infit MNSQs are all less than 1,5, implying a unidimensional scale is constructed.
The visual dashboard is shown in Figure 4. Interested readers are recommended to click the link at the reference [27] to manipulate the change for each domain in their way. The names on the map denote the one with the highest score on the domain, respectively.
The correlation between summation score and the age for head nurses is 0.18(t=1.5(=0,18*√(66-2)/(1-0.18Λ2))), indicating the two variables have no any significant relation. That is to say that the performance of head nurses on those ten-axes competences will not be increased or decreased along with their ages. Kendall’s W is 0.59( Χ2 =76.33. df=65, p=0.16), indicating the two variables as mentioned above are inconsistent.
4. Discussion
The results show that (1) the relation between Cronbach's α and Kendall's coefficient is significantly strong(r=0.61, t=5.87) in concordance(Kendall =0.85, χ2 =100.38,df=59, p< .0001); (2) the dashboard shown on the Google map with multidisciplinary functionalities is merit; (3) the association between summation scores and the age is trivial (r=0.18, t=1.5) without concordance (Kendall =0.59( χ2 =76.33, df=65, p=0.16).
In tradition, the fairness of assessments are not allowed to doubt or to challenge the nurse supervisors. The unanimous responses endorsed by the judge will result in unfairness and bias occurrence. The judgment researches in fairness include two-way ANOVA or internal class coefficient(ICC) [28,29]. Rasch many facets used releasing much valuable information[30] is originated by item response theory which is hard to be applied and interpreted in practice [31].
In the current study, we applied Kendal's W to assess the competence of head nurses in a hospital which is similar to many annual employees' evaluation (i.e., supervisor assessing the subordinates) and different from other competitions or contests by multi-referees or those OSCE-like examinations. The features of this study are those (1) building the questionnaire illustrated in Additional file 1; (2) demonstrating the scoring and assessing method in Figure 1 and Table 1); (3) plotting visual representations in Figure 3 and Figure 4.
Many journals [32-34] have used Google maps to show their research results. This study applied the layer design on Google maps to show the performance of head nurses on a dashboard which is a technique demonstration provided to hospital management for references in the future. After all, one picture is worth a thousand words. The animated dashboard is superior to the static image diagram.
Google maps provide an overall view of geospatial visualization with coordinates of latitude and longitude on a map . However, none applies the Google maps to build report performance sheet as we did, not mention to create the animated dashboard. We are interested in this kind of performance report card online for the current study. Using the application programming interface (API) [35]technique with the Google maps to build the dashboard is the strength of the study, see the references [25-27].
Researchers [36] addressed that training is so limited to help judges assess examinees. Even all judges perform excellently which cannot guarantee to avoid the unfairness occurrence [37,38]. The Kendall's coefficient of concordance is a way to assess the judge bias in occurrence.
The computation of Kendall's W is somewhat difficult, especially endorsing the mean to the tie in ranking. Even SPSS statistical software provides the tool to obtain the Kendall's W, many subscales all-in-one to gain the results like Table 1 is required to program a computer routine. We provide an mp4 video at the reference [39] or scan the QR-code in Figure 1 to introduce how to execute the routine in the calculation of the Kendall's W.
The forced ranking is suitable for using Kendall's W, but cannot discriminate the attributes of subordinates under each supervisor. For instance, the supervisor A assessed her head nurses with low variance and led a low to Kendall's W or Cronbach's , which might be the performance equal among head nurses under the supervisor A. We cannot attribute the low Kendall's W to the supervisor's bias or misbehavior. As such, the adjustment for a score to be equal would lead the result to another unfair problem. This is the first limitation.
Only one judge assessing her subordinates is simple but subjective enough to produce personal bias which is unfair in annual employee evaluation. This is the second limitation. Future studies are suggested to adopt the 360-degree evaluation [40] or OSCE-like multi-judge assessment to let the evaluation more objective.
The sample came from one hospital. The results like no relation to the summation score and the age cannot generalize to other hospitals or institutes which is another limitation. Hopefully, more studies may be examined further to generalize the result in the future.
5. Conclusion
The demonstration of performance sheet is shown on Google maps with a dashboard. The Kendall's coefficient of concordance can be used for an example in assessing the selection of the nurse head in the hospital as well as in evaluating many kinds of competition judged by referees in the future.
References
- Archer FB. The Gambia Colony And Protectorate: An Official Handbook. Psychology Press,1967, p. 296.
- Fatchett A. Social Policy for Nurses. Polity, 2012, p. 222.
- Lees, Liz. Nurse Facilitated Hospital Discharge. M&K Update Ltd., 2007, p. 80.
- Sarnecky MT. History of the United States Army Nurse Corps. University of Pennsylvania Press, 1999, p. 3.
- Englebright J, Perlin J.The chief nurse executive role in large healthcare systems.Nurs Adm Q. 2008 p;32(3):188-94.
- Melnyk BM, Gallagher-Ford L, Thomas BK, Troseth M, Wyngarden K, Szalacha L.A Study of Chief Nurse Executives Indicates Low Prioritization of Evidence-Based Practice and Shortcomings in Hospital Performance Metrics Across the United States. Worldviews Evid Based Nurs. 2016;13(1):6-14.
- Babaeipour-Divshali M, Amrollahimishavan F, Vanaki Z, Abdollahimohammad A, Firouzkouhi M.Effect of head nurse empowerment program on staff nurses' job satisfaction at two educational hospitals in Rasht, Iran. Iran J Nurs Midwifery Res. 2016;21(3):306-9.
- Kumar N, Bhardwaj S, Rahman E.Multiple mini-interview as a predictor of performance in the objective structured clinical examination among Physician Associates in the United Kingdom: a cohort study.Adv Med Educ Pract. 2018;9:239-245
- Tanaka P, Adriano A, Ngai L, Park YS, Marty A, Wakatsuki S, Brun C, Harrison K, Bushell E, Thomsen JLD, Wen L, Painter C, Chen M, Macario A.Development of an Objective Structured Clinical Examination Using the American Board of Anesthesiology Content Outline for the Objective Structured Clinical Examination Component of the APPLIED Certification Examination. A A Pract. 2018 Apr 23. [Epub ahead of print].
- Armstrong M. Armstrong’s handbook of human resource management practice. 11th ed. London: Kogan Page 2009;201-17.
- Lievens F, Sanchez JI, De Corte WD. Easing the inferential leap in competency modeling: the effects of task-related information and subject matter expertise. Pers Psychol 2004; 57:881- 904.
- Zhu Y, Chen I, Warner M. HRM in Taiwan: an empirical case study. HRM 2000; 10:32-44.
- Wanberg CR, Kanfer R, Rotundo M. Unemployed Individuals: motives, job-search competencies, and job-search constraints as predictors of job seeking and reemployment. J Appl Psychol 1999; 84: 897-910.
- Lieven F, Sanchez JI. Can training improve the quality of inferences made by raters in competency modeling? A quasi-experiment. J Appl Psychol 2007;92:812-9.
- Levenson AR, Van der Stede WA, Cohen SG. Measuring the relationship between managerial, competencies and performance. JOM 2013; 32:360-80.
- Kendall MG, Babington SB. The Problem of m Rankings. The Annals of Mathematical Statistics 1939; 10 (3): 275–287.
- Xu W, Chen Z, Zhang Y, Cheng L.Order Statistics Concordance Coefficient With Applications to Multichannel Biosignal Analysis. IEEE J Biomed Health Inform. 2017 Sep;21(5):1206-1215.
- Dasgupta S, Vaughan AS, Kramer MR, Sanchez TH, Sullivan PS. Use of a Google Map Tool Embedded in an Internet Survey Instrument: Is it a Valid and Reliable Alternative to Geocoded Address Data?JMIR Res Protoc. 2014 Apr 10;3(2):e24.
- Kobayashi S, Fujioka T, Tanaka Y, Inoue M, Niho Y, Miyoshi A. A geographical information system using the Google Map API for guidance to referral hospitals. J Med Syst. 2010 Dec;34(6):1157-60.
- Marco CA, Wahl RP, House HR, Goyal DG, Keim SM, Ma OJ, Joldersma KB, Johnston MM, Harvey AL. Physician Age and Performance on the American Board of Emergency Medicine ConCert Examination. Acad Emerg Med. 2018 Apr 2. doi: 10.1111/acem.13420. [Epub ahead of print].
- Alam F, LeBlanc VR, Baxter A, Tarshis J, Piquette D, Gu Y, Filipkowska C, Krywenky A, Kester-Greene N, Cardinal P, Au S, Lam S, Boet S, Clinical Trials Group PA. Does the age of acute care physicians impact their (1) crisis management performance and (2) learning after simulation-based education? A protocol for a multicentre prospective cohort study in Toronto and Ottawa, Canada.BMJ Open. 2018 Apr 21;8(4):e020940.
- Chien TW, Shao Y. Rasch analysis for continuous variables. Rasch Measurement Transactions 2016; 30(1), 1574-1576.
- Chien, T.W. , Shao, Y. Rasch analysis for continuous variables. Rasch Measurement Transactions 2016; 30(1), 1574-1576.
- Wilson M. Some Notes on the Term: "Wright Map". Rasch Measurement Transactions 2011; 25:3, 1331.
- Chien TW. Person-item map on Google maps for the study of selecting the best nurse head. 2018/5/6 retrieved at http://www.healthup.org. tw/kpiall/wrightmapb.asp?repno=7
- Chien TW. Cloud computation on Rach continuous responses for the study of selecting the best nurse head. 2018/5/6 retrieved at http://www.healthup.org.tw/ kpiall/ raschcontinous.asp?repno=7
- Chien TW. A dashboard of all members on Google maps for the study of selecting the best nurse head. 2018/5/6 retrieved at http://www.healthup.org.tw/gps/nursetendomai n.htm
- Shrout PE, Fleiss JL. Intraclass correlations: Uses in assessing rater reliability. Psychological Bulletin 1979; 86(2), 420-428.
- McGraw KO, Wong SP. Forming inferences about some intraclass correlation coefficients. Psychological Methods 1996; 1(1), 30-46.
- Monahan MP, Schumacker RE. An Analysis of Correctional Education GED Essays. the annual meeting of the Southwest Educational Research Association San Antonio, Texas, 2003.
- Lunz ME, Schumacker RE. Scoring and analysis of performance examinations: A comparison of methods and interpretations. Journal of Outcome Measurement 1997; 1(3), 219-238.
- Dasgupta S, Vaughan AS, Kramer MR, Sanchez TH, Sullivan PS. Use of a Google Map Tool Embedded in an Internet Survey Instrument: Is it a Valid and Reliable Alternative to Geocoded Address Data? JMIR Res Protoc.2014; 3(2): e24.
- Kaewpitoon SJ, Rujirakul R, Joosiri A, Jantakate S, Sangkudloa A, Kaewthani S, et al. GIS Database and Google Map of the Population at Risk of Cholangiocarcinoma in Mueang Yang District, Nakhon Ratchasima Province of Thailand. Asian Pac J Cancer Prev. 2016;17(3),1293-7.
- Kaewpitoon SJ, Rujirakul R, Sangkudloa A, Kaewthani S, Khemplila K, Cherdjirapong K, et al.. Distribution of the Population at Risk of Cholangiocarcinoma in Bua Yai District, Nakhon Ratchasima of Thailand Using Google Map. Asian Pac J Cancer Prev.2016;17(3), 1433-6.
- Aroca-Martínez G, Depine S, Consuegra-Machado JR, González-Torres HJ, Árquez-Mendoza M, Estrada-García E. Development and use of an application programming interface modified from Google Maps for the georeferencing of patients with glomerular disease. Nefrologia. 2015;35(1):118-20.
- LeMahieu P, Gitomer D, Eresh J. Portfolios in large-scale assessments: Difficult but not impossible. Educational Measurement: Issues and Practice 1995; 14(3), 11-28.
- Lunz M, Stahl J. New ways of thinking about reliability. Professions Education Researcher Quarterly 1992; 13, 4, 16-18.
- Lunz M, Stahl J, Wright B. Interjudge reliability and decision reproducibility. Educational and Psychological Measurement 1994; 54, 4, 913-925.
- Chien TW. The calculation of Kendall’s coefficient of concordance. 2018/5/10 retrieved athttp://www.healthup.org.tw/marketing/course /marketing/Kendall.mp4
- Atkins P, Wood R. Self-versus others' ratings as predictors of assessment center ratings: Validation evidence for 360-degree feedback programs. Personnel Psychology 2002; 55(4), 871–904.